Tron's USDT Economy Is Becoming an Everyday-Payments Network, Held Up by a Stable Desk Foundation
Everyone quotes the same top-line numbers for Tron: over $90 billion in USDT, more transfers than any other chain. Almost nobody looks at the shape underneath. We tranched every wallet that sent USDT on Tron by how often it sends, using Google BigQuery. The picture is a barbell: millions of everyday senders at one end, fewer than 10,000 professional desks at the other, and a middle that is growing faster than either.
The Finding
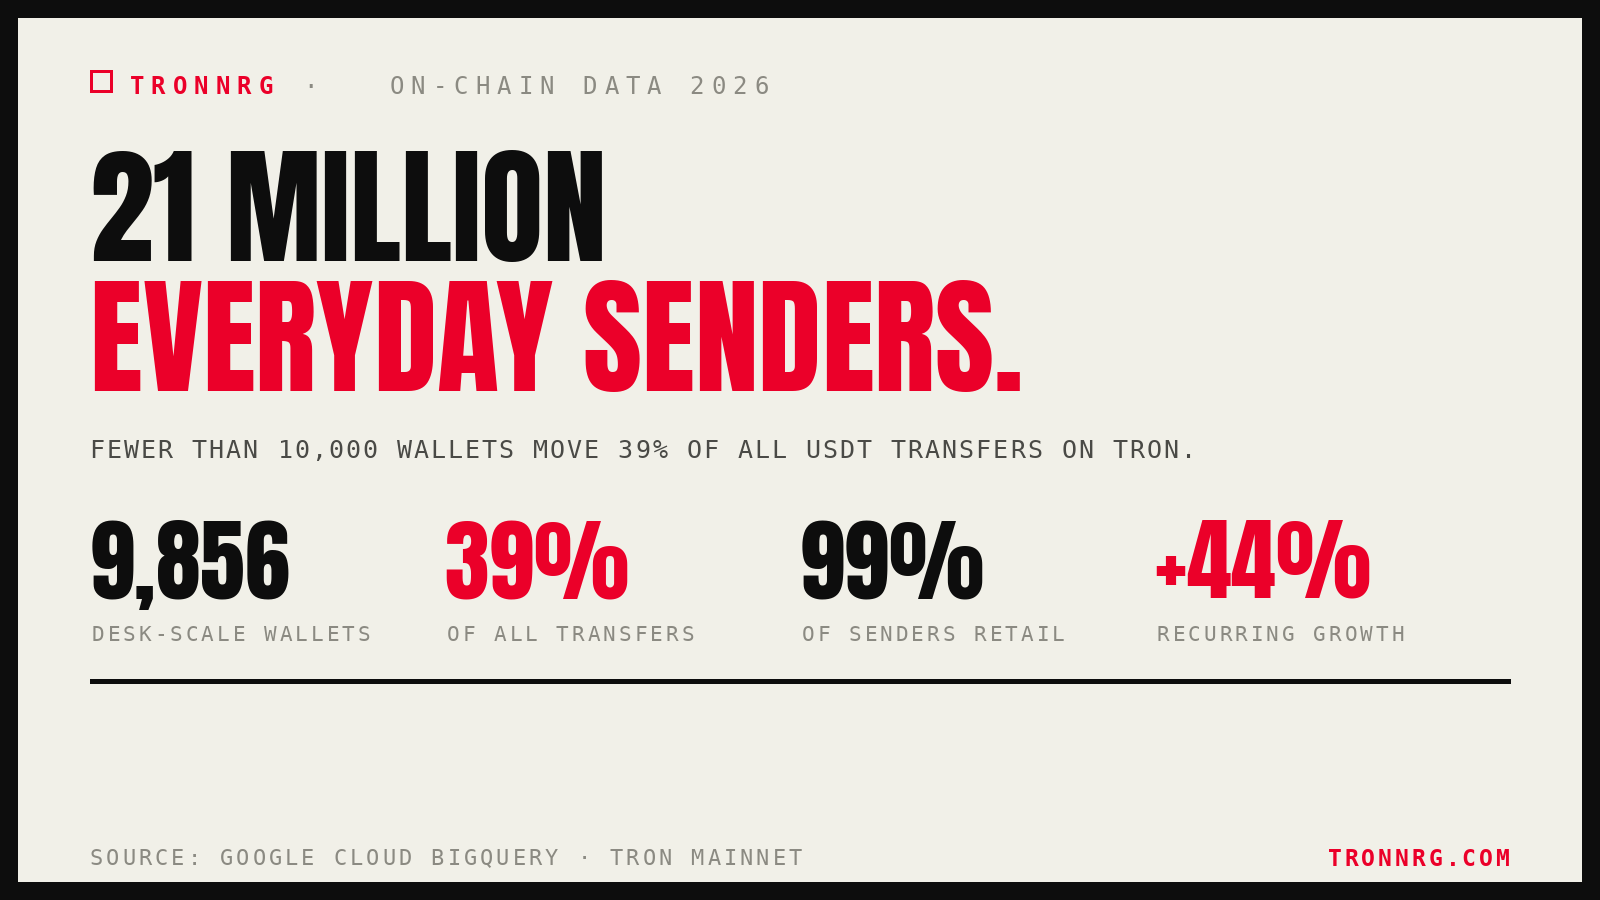
Fewer than 10,000 wallets move nearly 40% of every USDT transfer on Tron. That is under 0.05% of everyone who sends USDT. Strip out the 68 exchange-scale wallets that everyone already knows about, and roughly 9,800 desk-scale wallets still move a fifth of the network on their own.
At the other end sit the everyday senders. Ninety-nine percent of all sending wallets sent fewer than 100 transfers in the entire 90-day window. Together they account for 41.7% of transfers. Millions of people, each moving money a handful of times.
This is the shape of a payment network with a professional spine, not a trading venue. A barbell: a vast retail base at one end, a small, hard-working desk layer at the other, and the work of settlement shared between them.
How We Drew the Desk Line
We grouped every sending wallet by how many USDT transfers it made in the window, then looked at how often each group was actually active. The place to draw the line between a person and an operation is obvious once you plot it: it is the point where sending frequency jumps.
Below 1,000 transfers in 90 days, wallets look personal. The 100-999 band sends about 3.8 times on an active day and is quiet for stretches. Cross into the 1,000-plus band and the median wallet is active roughly 80 of 90 days and sends about 28 times a day, every day. That is a sevenfold jump in daily frequency and a shift to near-continuous operation. Nobody runs their personal wallet like that. A desk does.
So we set the desk floor at 1,000 transfers in 90 days, about 10 sends a day sustained. Above it we split small desks (1K-9.9K), medium desks (10K-99K), and exchange-scale wallets (100K+), the last of which are the public exchange and processor hot wallets that everyone can already name. The small and medium bands are where the independent OTC desks and P2P merchants live.
One honest caveat, carried through the whole piece. On-chain data shows behaviour, not identity. We can see a wallet that pulls USDT from many sources and pushes it out to many counterparties at an operational cadence. We cannot prove it belongs to a desk. We call these wallets "desk-like" and treat the count as an informed estimate, not a census.
What Changed Since 2024
Concentration is a snapshot. The more interesting question is what is growing. We ran the same classification month by month from January 2024 and compared annual averages, which strips out the noise of short and long months.
The answer is not what the market assumes. The desk layer is not booming. Neither is the casual base. The growth is in the middle, among recurring small senders: people who send often, in small amounts.
Recurring small senders grew about 44%. Casual senders grew about 9% and have been roughly flat since 2025. Desk-scale wallets grew about 12%, effectively flat, holding between 10,000 and 12,000 active in any month for nearly three years.
Read together, that means the network is deepening, not just widening. It is not mostly adding brand-new one-time users, and it is not adding desks. It is turning occasional senders into regular ones. That is what an economy looks like when people start using a rail for daily life rather than a one-off transfer.
Slowing headline growth is not a warning sign here. It is what maturity looks like. A chain in its acquisition phase adds users in waves; a chain that has already scaled stops adding them quickly and instead sees the users it has settle into habit. The tell is which tier is still climbing. It is not speculators or new desks. It is repeat everyday senders. Our new-wallet analysis shows the same shift from the other direction: the share of transfers going to a first-time wallet fell from 8.7% to 6.4% across the year. Fewer newcomers, more regulars.
And what those regulars come back for is not hype. There are no NFT cycles, meme seasons, or yield narratives holding this activity up. It is the same few thousand wallets clearing the same everyday flows, day after day, because the rail is cheap and it works. A network whose longevity rests on daily utility rather than the trend of the month is a durable one, and that is the quiet story the tiers tell. There is no narrative rotation here, no pivot from one theme to the next to stay relevant. Just a strong, steady flow.
The macro data points the same way. Tron now carries over $90 billion in USDT, more than Ethereum. In Q2 2026 it handled 52% of sub-$1,000 USDT transfers among chains that natively issue USDT, up from 43% a quarter earlier, and roughly 93% of its stablecoin transfer volume was peer-to-peer, the highest of any tracked chain. Our own transfer-size analysis found two in three transfers are under $1,000. The sub-$1,000 dominance the analysts report at the top is the same everyday activity our sender tiers show from the inside.
The Desk Foundation
The flat desk line is not a weakness in the story. It is the story. A stable spine of roughly 12,000 professional operations has carried a fifth of the network's transfers for three years while the everyday base grew around it.
That is what a foundation does. It does not need to grow in number for the building on top of it to get bigger. The same few thousand OTC desks and P2P merchants clear liquidity, price local currency, and settle for a base of small senders that keeps deepening. When a worker in the Gulf sends money home, or a trader in Lagos or Manila offloads USDT for local cash, a desk is usually on the other side.
We looked at how that layer formed in the rise of small OTC desks on Tron, and at how one is run in our guide to running a P2P desk. What the census adds is scale and stability: this is not a swelling crowd of newcomers, it is a defined professional cohort of around 12,000, doing more volume per operation than any other group on the chain.
There is one cost that this layer lives and dies by. Every USDT transfer a desk sends consumes Energy, and at 28 to 300-plus sends a day, the difference between burning TRX and delegating Energy compounds fast. It is the single largest controllable cost in the operation, and it is the reason the Energy rental market exists at all. For a desk, the shape of this data is not abstract. It is the margin.
Fewer than 10,000 wallets, under 0.05% of all senders, move nearly 40% of USDT transfers on Tron, while 99.1% of senders are retail-scale. The fastest-growing group is recurring small senders, up ~44% since 2024, on a desk layer that has stayed flat at ~12,000.
Methodology
Data source: Google BigQuery public dataset bigquery-public-data.goog_blockchain_tron_mainnet_us, the Google-hosted copy of Tron mainnet. We used the logs table, filtering for USDT TRC-20 Transfer events on contract TR7NHqjeKQxGTCi8q8ZY4pL8otSzgjLj6t and grouping by the sending address.
Tranche snapshot (the concentration table): a single 90-day window totalling 209,846,091 Transfer events across 21,167,358 distinct sending wallets. Bands are cumulative transfer counts over the window: under 10, 10-99, 100-999, 1,000-9,999, 10,000-99,999, and 100,000 or more. "Tx/day" is the median of each wallet's transfers divided by its active days.
Monthly census (the growth trend): the same classification run per calendar month from January 2024 to August 2026, with wallet thresholds scaled to a monthly basis (under 30, 30-299, 300-2,999, 3,000-29,999, 30,000 or more). We report annual averages of the monthly wallet counts. The current partial month is excluded. Short months such as February pull some wallets under a fixed monthly threshold, so we use annual averages rather than raw month-to-month values to avoid that artifact.
The desk definition: desk-scale means a non-exchange wallet sending at an operational cadence, roughly 10 or more transfers a day sustained across the window. This is a behavioral inference, not a confirmed identity. Some desk-like wallets are OTC desks or P2P merchants, some are automated business systems, and a share will be misclassified in either direction. The 1,000-per-90-days floor was chosen because median daily frequency jumps about sevenfold at that boundary and active-day counts move to near-continuous, marking the shift from personal to operational use.
What we did not measure: this is a count of transfers and wallets, not a value or cost figure, and on-chain data cannot tell delegated Energy from burned TRX or reveal a wallet's geography. We deliberately make no claim about which countries these wallets are in. Any regional reading is a hypothesis for external adoption data to test, not something this dataset shows.
Reproducibility: the queries are standard SQL runnable by anyone with a Google BigQuery account against the public Tron dataset.
Sources cited:
- Google BigQuery:
bigquery-public-data.goog_blockchain_tron_mainnet_us.logs - USDT contract: TR7NHqjeKQxGTCi8q8ZY4pL8otSzgjLj6t
- Q2 2026 market figures: CoinDesk, TRON Network Quarterly Report Q2 2026 (52% sub-$1,000 native-issuance share, ~93% P2P volume)
- USDT supply overtaking Ethereum: The Block, USDT on Tron exceeds $90 billion