Tron & USDT Statistiken 2026: Alle Zahlen auf einen Blick
Alle konkreten Zahlen, die wir zu USDT auf Tron gemessen haben, auf einer Seite gesammelt. Transfervolumen, eindeutige Absender, Transfergrößen, Fehlerquoten und Gebühren – jede Zahl verlinkt zur vollständigen Analyse und ist mit Quelle und Datum versehen. Die meisten stammen aus unseren eigenen SQL-Abfragen gegen den öffentlichen Tron-Datensatz von Google Cloud. Diese Seite wird aktiv gepflegt: Wir aktualisieren sie, sobald neue Daten vorliegen. Wer über Tron oder Stablecoins schreibt und eine zitierbare Zahl benötigt, fängt hier an.
✍ Von Mo Kasseum📅 Jul 16, 2026🔄 Updated Nov 4, 2026⏱ 7 min read🏷 Daten
Pastes the graphic with a credit link back to this page. Free to use with attribution.
The headline numbers
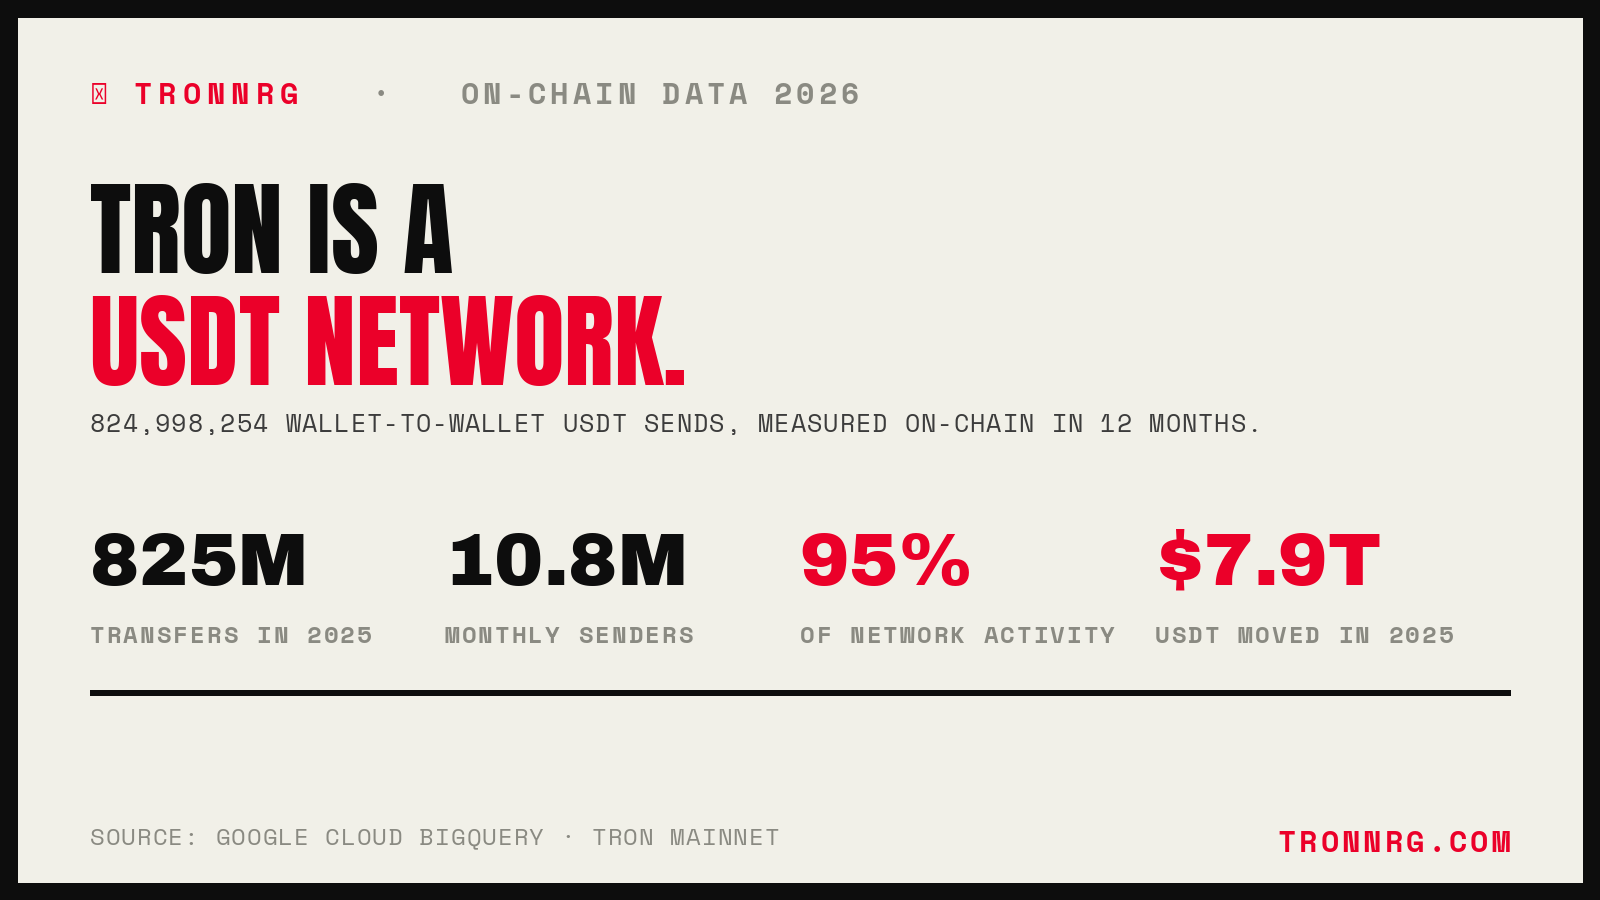
824,998,254 USDT transfers on Tron in 12 months (Apr 2025 – Mar 2026)
10.8 million unique sending wallets in a single month (Dec 2025)
<10,000 wallets move nearly 40% of all transfers, while 99% of senders are retail
95.2% of all Tron smart contract activity is USDT transfers
67% of USDT transfers are under $1,000, real people, real money
$700 million burned by Tron users in avoidable fees in 2025
$7.9 trillion in USDT moved on Tron in 2025
3.85 billion USDT frozen by Tether across 9,141 wallets since 2020; only 10.9% of freezes ever reversed
This is a reference page, not an essay. Below are the numbers we have measured or verified about USDT on Tron, grouped by theme. Each one is liftable on its own, and each links to the full analysis behind it. Where a figure is ours, it comes from SQL run against Google Cloud's public Tron dataset. Where it is someone else's, the source is named.
Scale of the Network
824,998,254
USDT transfers on Tron in one year. Every discrete wallet-to-wallet send between April 2025 and March 2026. That is about 2.3 million per day, 95,000 per hour, 26 every second, for a full year.
Source: TronNRG on-chain analysis · Google BigQuery public Tron dataset · Mar 2026.
10.8M
Unique sending wallets in a single month. December 2025 saw 10,842,400 distinct addresses send USDT at least once, up 28% from 8.45 million nine months earlier.
Source: TronNRG on-chain analysis · BigQuery COUNT(DISTINCT from_address) · Mar 2026.
95.2%
Of Tron smart contract activity is USDT. Across the 12-month study, USDT transfers made up 95.2% of all smart contract calls, reaching 96.5% by March 2026. Tron is, in practice, a USDT settlement network.
Source: TronNRG on-chain analysis · BigQuery · Mar 2026.
9,856
Wallets move nearly 40% of all transfers. Fewer than 10,000 desk-scale wallets, under 0.05% of all senders, carry 39% of USDT transfers, while 99.1% of senders are retail-scale. The desk layer has held flat near 12,000 since 2024 as the everyday base deepened.
Source: TronNRG sender-concentration analysis · BigQuery, 209.8M transfers · Sep 2026.
How People Use USDT
67%
Of transfers are under $1,000. We checked 75 million transfers. 37.86% fell in the $100–$1,000 band, the remittance and everyday-payment range. This is not whales moving treasury. It is people sending money.
Source: TronNRG transfer-size analysis · BigQuery, 75M transfers · Apr 2026.
−35.8%
Saturday volume drop. USDT activity falls 35.8% on Saturdays. The daily peak is 14:00 UTC, when Asian, European and American hours overlap; the engine starts at 05:00 UTC. Humans take weekends off. Bots do not.
Source: TronNRG timing heatmap · BigQuery, 75M transfers · Apr 2026.
The Fee Problem
13 → 4 TRX
The cost of one USDT transfer. Without Energy the network burns about 13 TRX per send. With delegated Energy it costs about 4 TRX, roughly a 70% cut. A standard transfer needs 65,000 Energy; a first send to a new wallet needs 130,000.
Source: What Is Tron Energy · Energy requirements.
$700M
Burned in avoidable fees in 2025. Tron generated $3.51 billion in revenue that year. 92% of its Energy was consumed by USDT transfers, and about half of that was paid by users burning TRX at full cost instead of loading Energy first.
Source: TronNRG fee analysis · BigQuery · Mar 2026.
3.2M
Failed USDT transfers in a year, every one avoidable. Of 834 million transfers queried, 3.2 million failed, most for lack of Energy or resources. That is roughly 8,851 people a day watching a send bounce.
Source: TronNRG failure analysis · BigQuery, 834M transfers · Apr 2026.
The Blacklist
All figures on this page are read from the Tether-issued TRC-20 contract TR7NHqjeKQxGTCi8q8ZY4pL8otSzgjLj6t. The contract addresses for USDT and USDC on every other chain are in our verified reference list.
3.85B
USDT frozen on Tron right now. Held across 5,254 blacklisted wallets that still carry a balance, median about 65,000 USDT each. The largest single frozen wallet holds 312.7 million, locked on 29 October 2026 in connection with the Binance incident. Net of the 608 million USDT Tether has destroyed.
Source: USDT Freeze Statistics · BigQuery, USDT contract events, Jun 2020 to 2 Nov 2026.
9,141
Wallets frozen since 2020. 9,172 freeze actions on 9,141 addresses in six years; 8,164 remain blacklisted today. Against 21 million wallets that sent USDT in a single 90-day window, the whole six-year blacklist is fewer than one in two thousand. 2026 is the busiest year on record with 3,817 freezes to 2 November, already past 2025's full-year 3,509.
Source: USDT Freeze Statistics · BigQuery · independent check: BlockSec counted 3,506 Tron addresses for 2025, we count 3,509.
10.9%
Of freezes are ever reversed. When a wallet is released the median wait is 49 days; the fastest was same-day and the slowest 1,057 days. May 2026 is the only month in the record where releases (459) outnumbered new freezes (291).
Source: USDT Freeze Statistics · first RemovedBlackList after each AddedBlackList, per address.
608M
USDT destroyed by Tether. 1,270 DestroyedBlackFunds events since 2020, mostly to recover stolen funds for reissue. The biggest single burn was 29.6 million in November 2024; the biggest month was October 2025 at 73.3 million. The first address Tether ever froze on Tron, in June 2020, was the USDT contract itself, to recover tokens users had sent there by mistake.
Source: USDT Freeze Statistics · BigQuery, DestroyedBlackFunds event data.
Market Context
$7.9T
In USDT moved on Tron in 2025. More than the annual GDP of Germany. Tron carried roughly 65% of all retail stablecoin transfers globally, with about 1.15 million daily active wallets.
Source: What $7.9T Means · Messari & Nansen year-end reports · Jan 2026.
$7.2T
Stablecoins surpassed US banking rails. In February 2026 stablecoins settled $7.2 trillion in a single month, passing the US ACH network for the first time.
Source: Stablecoins Surpassed US Banking · Apr 2026.
$155B
Total USDT in circulation. Tether's supply reached $155 billion in 2026, making USDT the most transacted crypto asset in the world, more than Bitcoin by transaction count.
Source: Tether's $155 Billion · Feb 2026.
Methodology & How to Cite
Figures marked as ours come from SQL queries run against Google Cloud's BigQuery public blockchain dataset (bigquery-public-data.goog_blockchain_tron_mainnet_us), the official Google-hosted copy of the Tron mainnet. Anyone with a Google Cloud account can reproduce them by running the same queries against the same dataset. Full methodology sits inside each linked post. Figures from third parties (Messari, Nansen, Tether) are attributed to their source and date.
This page is maintained and dated. Numbers are refreshed as new on-chain periods close. The last update is shown in the byline above.
Cite this page
TronNRG, "Tron & USDT Statistics 2026," tronnrg.com/en/blog/tron-usdt-statistics/. Please link to this page rather than copying the table, so readers reach the latest figures.
FAQ
Wie viele USDT-Transfers finden täglich auf Tron statt?
Rund 2.3 Millionen pro Tag. Unsere Analyse von 12 Monaten On-Chain-Daten über Google BigQuery zählte 824,998,254 USDT-Transfers auf Tron zwischen April 2025 und März 2026 – im Schnitt etwa 2.3 Millionen pro Tag.
Wie viele Menschen nutzen USDT auf Tron?
Im Dezember 2025, dem Spitzenmonat in unserem Datensatz, sendeten 10,842,400 eindeutige Wallet-Adressen mindestens einmal USDT auf Tron. Gezählt werden dabei einzelne Absenderadressen, nicht individuelle Personen – eine Person kann mehrere Wallets kontrollieren.
Welcher Anteil der Tron-Aktivität entfällt auf USDT?
USDT-Transfers machten in unserem 12-monatigen Untersuchungszeitraum 95.2% aller Smart-Contract-Aufrufe auf Tron aus – im März 2026 stieg dieser Wert auf 96.5%. Tron fungiert im Wesentlichen als USDT-Transfernetzwerk.
Was kostet ein USDT-Transfer auf Tron?
Ohne Energie verbrennt eine normale USDT-Überweisung etwa 13 TRX an Gebühren. Mit delegierter Energie kostet sie nur etwa 4 TRX – das entspricht einer Ersparnis von rund 70 %. Eine Standardüberweisung benötigt 65.000 Energie; eine erste Überweisung an ein brandneues Wallet benötigt 130.000.
Wie viel verloren Tron-Nutzer durch vermeidbare USDT-Gebühren?
Rund $700 Millionen im Jahr 2025. Unsere On-Chain-Analyse ergab, dass Tron in diesem Jahr $3,51 Milliarden an Einnahmen generierte, wobei 92 % der verbrauchten Energie auf USDT-Überweisungen entfiel – und etwa die Hälfte davon von Nutzern bezahlt wurde, die TRX zum vollen Satz verbrennen, anstatt vorher Energie zu laden.
Wie viel USDT bewegt Tron in einem Jahr?
Laut Jahresendanalysen von Messari und Nansen bewegte Tron im Jahr 2025 rund $7,9 Billionen in USDT – das entspricht etwa 65 % aller globalen Retail-Stablecoin-Transfers weltweit.