SISTEMA EN LÍNEA · ÚLTIMO DESPACHO: HACE 3.1sENERGÍA DELEGADA HOY: 13,402 TRANSACCIONESCOMISIÓN ESTÁNDAR: 13 TRX → CON TRONENERGY: 4 TRXUPTIME: 99.97% · DESPACHO PROMEDIO: 2.8 SEGUNDOSSISTEMA EN LÍNEA · ÚLTIMO DESPACHO: HACE 3.1sENERGÍA DELEGADA HOY: 13,402 TRANSACCIONESCOMISIÓN ESTÁNDAR: 13 TRX → CON TRONENERGY: 4 TRXUPTIME: 99.97% · DESPACHO PROMEDIO: 2.8 SEGUNDOS
Estadísticas de Tron y USDT 2026: Los datos, en un solo lugar
Todos los datos concretos que hemos medido sobre USDT en Tron, reunidos en una sola página. Volumen de transferencias, remitentes únicos, montos transferidos, tasas de error y comisiones: cada cifra enlaza al análisis completo e incluye su fuente y fecha. La mayoría proviene de nuestras propias consultas SQL ejecutadas contra el dataset público de Tron en Google Cloud. Esta página se mantiene activa: la actualizamos a medida que llegan nuevos datos. Si está escribiendo sobre Tron o stablecoins y necesita una cifra citable, empiece aquí.
Pastes the graphic with a credit link back to this page. Free to use with attribution.
The headline numbers
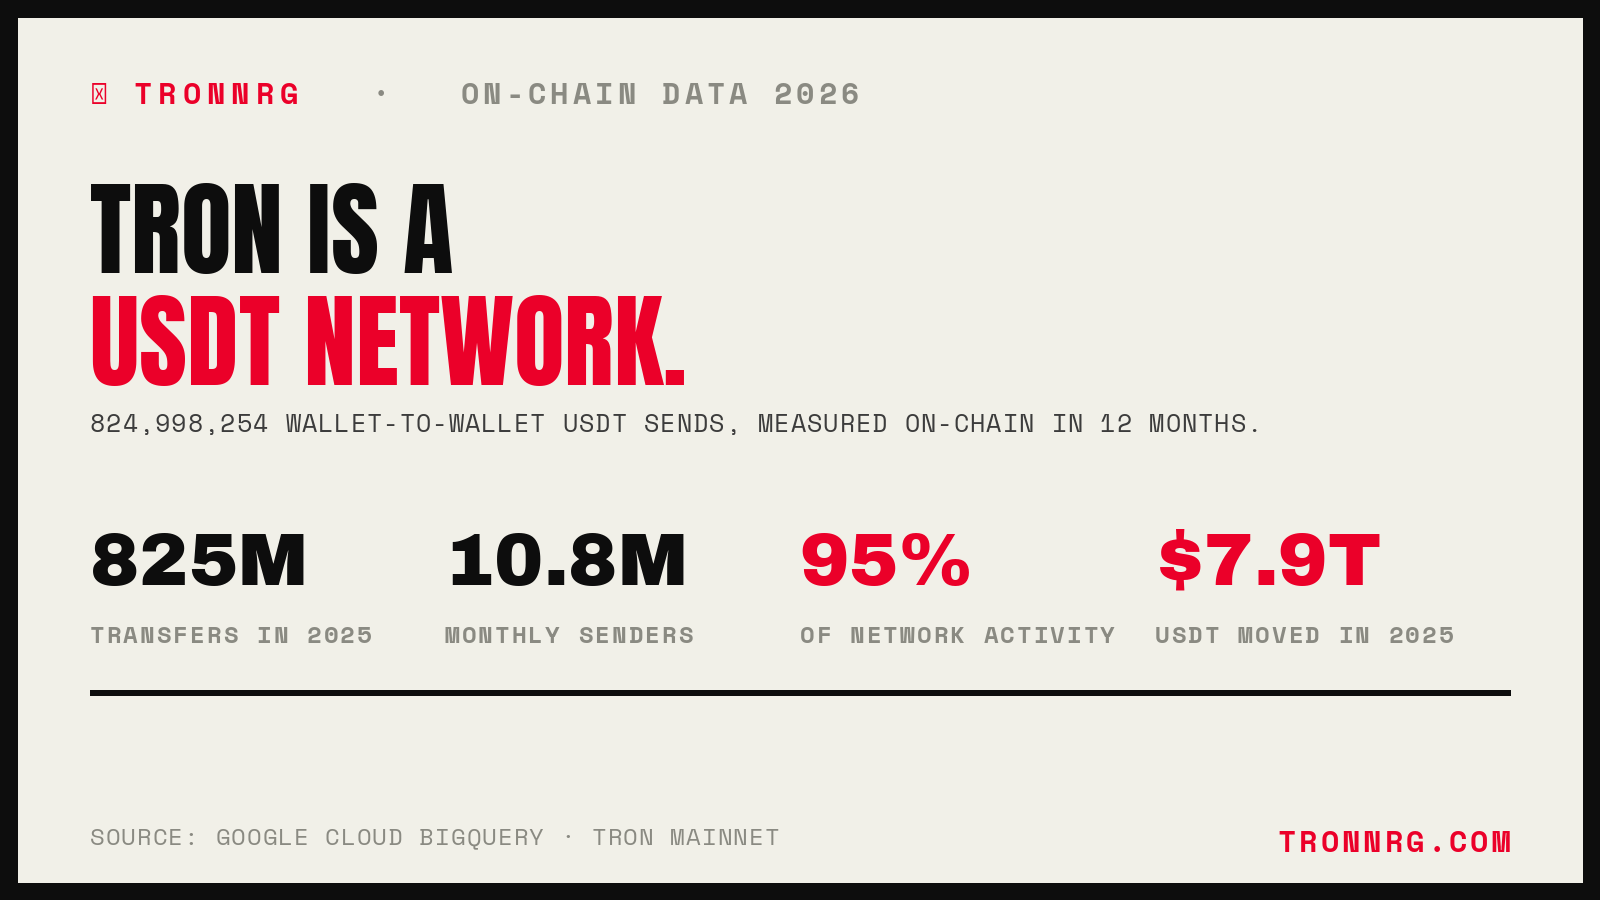
824,998,254 USDT transfers on Tron in 12 months (Apr 2025 – Mar 2026)
10.8 million unique sending wallets in a single month (Dec 2025)
<10,000 wallets move nearly 40% of all transfers, while 99% of senders are retail
95.2% of all Tron smart contract activity is USDT transfers
67% of USDT transfers are under $1,000, real people, real money
$700 million burned by Tron users in avoidable fees in 2025
$7.9 trillion in USDT moved on Tron in 2025
This is a reference page, not an essay. Below are the numbers we have measured or verified about USDT on Tron, grouped by theme. Each one is liftable on its own, and each links to the full analysis behind it. Where a figure is ours, it comes from SQL run against Google Cloud's public Tron dataset. Where it is someone else's, the source is named.
Scale of the Network
824,998,254
USDT transfers on Tron in one year. Every discrete wallet-to-wallet send between April 2025 and March 2026. That is about 2.3 million per day, 95,000 per hour, 26 every second, for a full year.
Source: TronNRG on-chain analysis · Google BigQuery public Tron dataset · Mar 2026.
10.8M
Unique sending wallets in a single month. December 2025 saw 10,842,400 distinct addresses send USDT at least once, up 28% from 8.45 million nine months earlier.
Source: TronNRG on-chain analysis · BigQuery COUNT(DISTINCT from_address) · Mar 2026.
95.2%
Of Tron smart contract activity is USDT. Across the 12-month study, USDT transfers made up 95.2% of all smart contract calls, reaching 96.5% by March 2026. Tron is, in practice, a USDT settlement network.
Source: TronNRG on-chain analysis · BigQuery · Mar 2026.
9,856
Wallets move nearly 40% of all transfers. Fewer than 10,000 desk-scale wallets, under 0.05% of all senders, carry 39% of USDT transfers, while 99.1% of senders are retail-scale. The desk layer has held flat near 12,000 since 2024 as the everyday base deepened.
Source: TronNRG sender-concentration analysis · BigQuery, 209.8M transfers · Sep 2026.
How People Use USDT
67%
Of transfers are under $1,000. We checked 75 million transfers. 37.86% fell in the $100–$1,000 band, the remittance and everyday-payment range. This is not whales moving treasury. It is people sending money.
Source: TronNRG transfer-size analysis · BigQuery, 75M transfers · Apr 2026.
−35.8%
Saturday volume drop. USDT activity falls 35.8% on Saturdays. The daily peak is 14:00 UTC, when Asian, European and American hours overlap; the engine starts at 05:00 UTC. Humans take weekends off. Bots do not.
Source: TronNRG timing heatmap · BigQuery, 75M transfers · Apr 2026.
The Fee Problem
13 → 4 TRX
The cost of one USDT transfer. Without Energy the network burns about 13 TRX per send. With delegated Energy it costs about 4 TRX, roughly a 70% cut. A standard transfer needs 65,000 Energy; a first send to a new wallet needs 130,000.
Source: What Is Tron Energy · Energy requirements.
$700M
Burned in avoidable fees in 2025. Tron generated $3.51 billion in revenue that year. 92% of its Energy was consumed by USDT transfers, and about half of that was paid by users burning TRX at full cost instead of loading Energy first.
Source: TronNRG fee analysis · BigQuery · Mar 2026.
3.2M
Failed USDT transfers in a year, every one avoidable. Of 834 million transfers queried, 3.2 million failed, most for lack of Energy or resources. That is roughly 8,851 people a day watching a send bounce.
Source: TronNRG failure analysis · BigQuery, 834M transfers · Apr 2026.
Market Context
$7.9T
In USDT moved on Tron in 2025. More than the annual GDP of Germany. Tron carried roughly 65% of all retail stablecoin transfers globally, with about 1.15 million daily active wallets.
Source: What $7.9T Means · Messari & Nansen year-end reports · Jan 2026.
$7.2T
Stablecoins surpassed US banking rails. In February 2026 stablecoins settled $7.2 trillion in a single month, passing the US ACH network for the first time.
Source: Stablecoins Surpassed US Banking · Apr 2026.
$155B
Total USDT in circulation. Tether's supply reached $155 billion in 2026, making USDT the most transacted crypto asset in the world, more than Bitcoin by transaction count.
Source: Tether's $155 Billion · Feb 2026.
Methodology & How to Cite
Figures marked as ours come from SQL queries run against Google Cloud's BigQuery public blockchain dataset (bigquery-public-data.goog_blockchain_tron_mainnet_us), the official Google-hosted copy of the Tron mainnet. Anyone with a Google Cloud account can reproduce them by running the same queries against the same dataset. Full methodology sits inside each linked post. Figures from third parties (Messari, Nansen, Tether) are attributed to their source and date.
This page is maintained and dated. Numbers are refreshed as new on-chain periods close. The last update is shown in the byline above.
Cite this page
TronNRG, "Tron & USDT Statistics 2026," tronnrg.com/en/blog/tron-usdt-statistics/. Please link to this page rather than copying the table, so readers reach the latest figures.
FAQ
¿Cuántas transferencias de USDT ocurren en Tron por día?
Alrededor de 2.3 millones por día. Nuestro análisis de 12 meses de datos on-chain mediante Google BigQuery contabilizó 824,998,254 transferencias de USDT en Tron entre abril de 2025 y marzo de 2026, con un promedio de aproximadamente 2.3 millones diarios.
¿Cuántas personas usan USDT en Tron?
En diciembre de 2025, el mes de mayor actividad en nuestro conjunto de datos, 10,842,400 direcciones de billetera únicas enviaron USDT en Tron al menos una vez. Este recuento corresponde a direcciones de envío distintas, no a personas individuales, ya que una misma persona puede controlar varias billeteras.
¿Qué porcentaje de la actividad en Tron corresponde a USDT?
Las transferencias de USDT representaron el 95.2% de todas las llamadas a contratos inteligentes en Tron durante nuestro estudio de 12 meses, cifra que subió al 96.5% en marzo de 2026. Tron funciona en gran medida como una red de transferencias de USDT.
¿Cuánto cuesta una transferencia de USDT en Tron?
Sin Energía, una transferencia estándar de USDT quema aproximadamente 13 TRX en comisiones. Con Energía delegada, el costo es de aproximadamente 4 TRX, una reducción de cerca del 70%. Una transferencia estándar necesita 65,000 de Energía; una primera transferencia a una billetera completamente nueva necesita 130,000.
¿Cuánto perdieron los usuarios de Tron en comisiones evitables de USDT?
Alrededor de $700 millones en 2025. Nuestro análisis on-chain reveló que Tron generó $3.51 billion en ingresos ese año, con el 92% de la Energía consumida por transferencias de USDT, y aproximadamente la mitad pagada por usuarios que quemaron TRX a la tarifa completa en lugar de cargar Energía primero.
¿Cuánto USDT mueve Tron en un año?
Tron movió aproximadamente $7.9 trillion en USDT durante 2025, según análisis de fin de año de Messari y Nansen, representando cerca del 65% de todas las transferencias minoristas de stablecoins a nivel mundial.